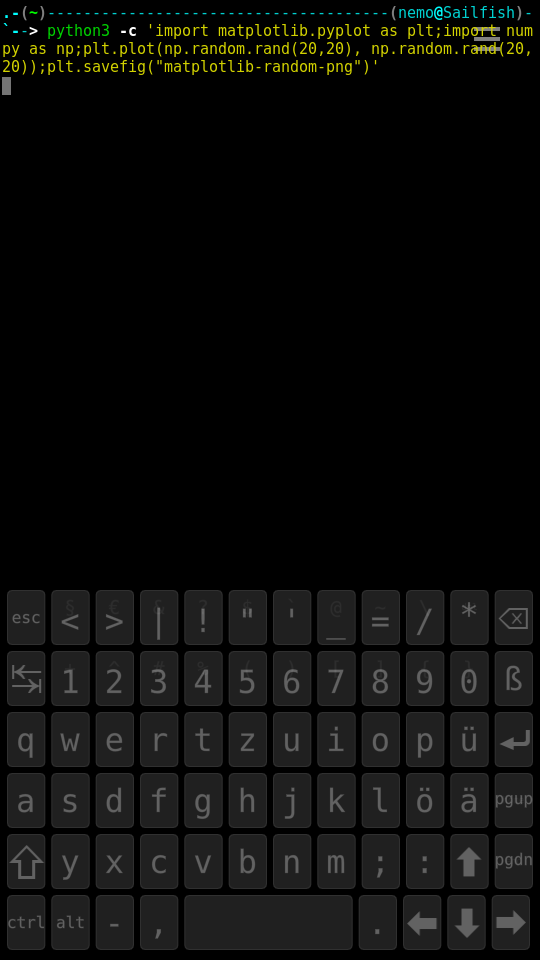
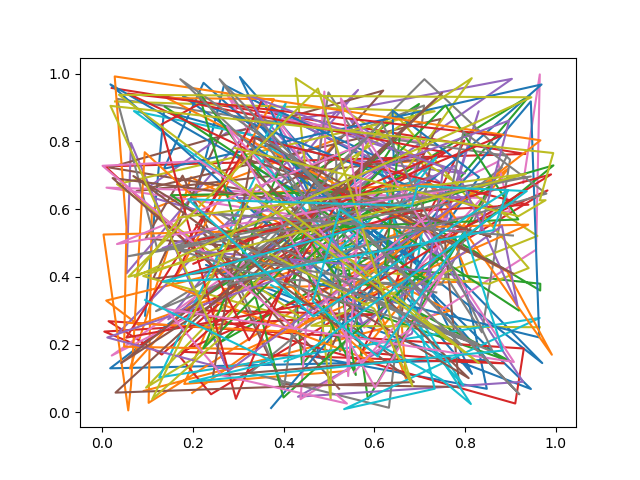
python3-matplotlib
This Matplotlib was built directly on a Jolla Phone/Xperia X. See my fork of Matplotlib to see how I did it. Due to Python version 3.4 on SailfishOS < 3.0.2.8 Oulanka, Matplotlib version 2.2.3 is the highest possible Matplotlib up to SailfishOS Oulanka as the Matplotlib version 3.0.0 requires Python 3.5+ and Matplotlib version 3.1 even Python 3.6+. From Oulanka on, Matplotlib > version 3 is installable.
Matplotlib is a Python 2D plotting library which produces publication quality figures in a variety of hardcopy formats and interactive environments across platforms. Matplotlib can be used in Python scripts, the Python and IPython shells, the Jupyter notebook, web application servers, and four graphical user interface toolkits.
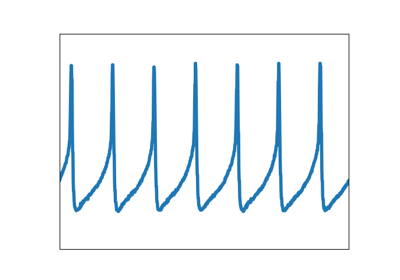
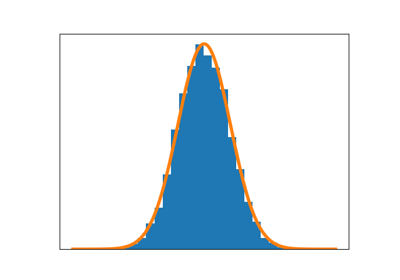
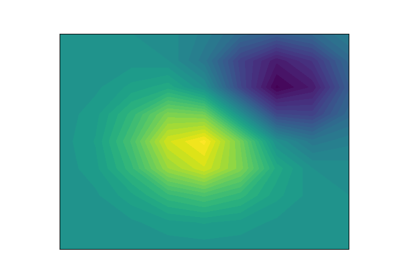
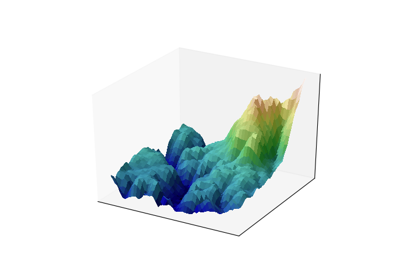
Matplotlib tries to make easy things easy and hard things possible. You can generate plots, histograms, power spectra, bar charts, errorcharts, scatterplots, etc., with just a few lines of code. For examples, see the sample plots and thumbnail gallery.
For simple plotting the pyplot module provides a MATLAB-like interface, particularly when combined with IPython. For the power user, you have full control of line styles, font properties, axes properties, etc, via an object oriented interface or via a set of functions familiar to MATLAB users.
Category:
| Attachment | Size | Date |
|---|---|---|
| 12.33 MB | 01/11/2018 - 16:23 | |
| 9.98 MB | 25/03/2019 - 20:14 | |
| 10.31 MB | 10/08/2019 - 19:34 | |
| 13.45 MB | 16/04/2020 - 15:53 |
(none)
Laatste reacties